Analyzing source code
For analyzing code to see how it works or is not working as the case may be, one could use ctags from within your editor. However this is a little like a choose your own adventure as the number of possible paths through any significant code base is very large. When debugging though, the right path is chosen automatically which can really narrow things down quickly. For example, recently I had to figure out why the zvbi library was not demodulating the bits correctly from the raw VBI image shown below (from an NTSC TV channel).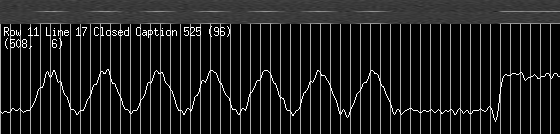
The code was quite complicated so I fired up the debugger and stepped into the decoder function (slicer) and put a watchpoint on the
b
variable which represents the decoded bit. After several hundred iterations through the loop the code would break
when the bit value changed, and I could quickly see the problem (a wrong CRI value).
Note the display of the code in a separate window below. This functionality is built into gdb but not enabled by
default.
I find gdb unusable without this, so to enable it use the Ctrlxa key combination, or start gdb with the
--tui
command line option.
   ┌──bit_slicer.c─────────────────────────────────────────────────────────────┐
   │347                     bs->thresh += (int)(raw0 - tr)                     │
   │348                             * (int) ABS ((int)(raw0sum - raw0));       │
   │349                                                                        │
   │350                     b = (raw0 >= tr);                                  │
   │351                                                                        │
  >│352                     if (unlikely (b ^ b1)) {                           │
   │353                             cl = bs->oversampling_rate >> 1;           │
   │354                     } else {                                           │
   │355                             cl += bs->cri_rate;                        │
   │356                                                                        │
   │357                             if (cl >= bs->oversampling_rate) {         │
   │358                                     if (unlikely (NULL != points)) {   │
   │359                                             points->kind = VBI3_CRI_BIT│
   └───────────────────────────────────────────────────────────────────────────┘
multi-thre Thread -120813 In: low_pass_bit_slicer_Y8   Line: 352  PC: 0x8070c7f
Continuing.
Hardware watchpoint 7: b

Old value = 8 '\b'
New value = 1 '\001'
low_pass_bit_slicer_Y8 (bs=0x95bb5e4, buffer=0x95eb050 "", points=0x0,
    n_points=0x0,
Analyzing errors
Obviously a debugger comes into its own here, but surprisingly some people tend not to use debuggers even in this situation. Here is another example from the linux kernel module that was used to read the VBI data mentioned above to show how quickly a problem can be pinpointed. The followingOOPSsometimes occurred when changing TV channels.
BUG: unable to handle kernel NULL pointer dereference at address 0000003c
 printing eip:
ded5e2fa
*pde = 18c1c067
Oops: 0000 [#1]
last sysfs file: /devices/platform/i2c-9191/9191-0290/beep_enable
Modules linked in: i915 drm ipv6 em28xx_audio(U) tuner_xc5000(U) em28xx(U) ...
CPU:    0
EIP:    0060:[<ded5e2fa>]    Not tainted VLI
EFLAGS: 00013282   (2.6.17-1.2264_FC5_Lincor #1)
EIP is at em28xx_uninit_isoc+0x21/0x74 [em28xx]
eax: d91ff000   ebx: ddf1a000   ecx: 00000000   edx: d1844550
esi: 00000002   edi: 000001e0   ebp: ddf1a000   esp: d91ffe18
ds: 007b   es: 007b   ss: 0068
Process vlc (pid: 8377, threadinfo=d91ff000 task=d1844550)
Stack: 000001e0 00000000 c0cc5605 000001e0 ded59cd2 40085618 d91ffed0 ded5489e
       dd668000 dddcf524 ddfe3d40 00000000 d91ff000 000001e0 00203246 00001000
       000000d0 000002d0 00203246 00000000 00203002 ddfef3c0 00000000 000001e0
Call Trace:
 <ded59cd2> em28xx_video_do_ioctl+0x8f8/0x149c [em28xx]  <ded5489e> em28xx_vi...
 <c05ff196> __mutex_unlock_slowpath+0x1e7/0x1ef  <ded00348> video_usercopy+0x...
 <c0463adf> chrdev_open+0x0/0x1a8  <c045a9a0> __dentry_open+0xda/0x186
 <c045aac6> nameidata_to_filp+0x24/0x33  <c045ab07> do_filp_open+0x32/0x39
 <ded54906> em28xx_v4l2_ioctl_fops+0x0/0x2 [em28xx]  <ded54902> em28xx_v4l2_i...
 <ded593da> em28xx_video_do_ioctl+0x0/0x149c [em28xx]  <c046be62> do_ioctl+0x...
 <c046c070> vfs_ioctl+0x1ff/0x216  <c046c0d3> sys_ioctl+0x4c/0x65
 <c0402cb3> syscall_call+0x7/0xb
Code: 00 00 e8 26 f7 ff ff 5a 5b c3 57 56 31 f6 53 89 c3 83 ec 04 8b 84 b3 c5...
EIP: [<ded5e2fa>] em28xx_uninit_isoc+0x21/0x74 [em28xx] SS:ESP 0068:d91ffe18
So I just started gdb with the binary kernel module as a parameter and pasted in the highlighted portion as shown below, to show the exact line offset 0x21 bytes into the function. This allowed me to immediately pinpoint that the dev->urb[] array was not always fully initialized.
$ gdb em28xx.ko
(gdb) list *em28xx_uninit_isoc+0x21
0xa2fa is in em28xx_uninit_isoc (.../em28xx-core.c:1246).
1241    {
1242            int i;
1243            for (i = 0; i < EM28XX_NUM_BUFS; i++) {
1244                    if (dev->urb[i]) {
1245                            usb_kill_urb(dev->urb[i]);
1246                            if (dev->urb[i]->transfer_buffer) {
1247                                    usb_buffer_free(dev->udev,
1248                                            dev->urb[i]->transfer_buffer_le>
1249                                            dev->urb[i]->transfer_buffer,
1250                                            dev->urb[i]->transfer_dma);
Note you can get traces like in the OOPS above in your own applications by using the backtrace
function
from glibc. I've been using this for years with a simple wrapper module.
GDB Essential commands
The command set of GDB really is quite concise and intuitive,so learn it now so you don't have to when things are going pear shaped!
| Command | Abbrev | Description |
| set args | set command args. Also can do: gdb --args command arg1 ... | |
| start | set breakpoint at main and run. Also can pass arguments | |
| break | b | set breakpoint (at function, line number, ...) |
| tbreak | tb | set breakpoint and clear when hit |
| break ... if ... | auto continue until condition met | |
| watch | wa | break when variable changes value |
| disable | dis | disable breakpoints (all by default) |
| enable | en | enable breakpoints (all by default) |
| run | r | (re)start execution |
| start | sta | tbreak main; run |
| continue | c | continue execution |
| step | s | next line |
| next | n | next line without recursing into functions |
| finish | fin | next line after this function returns |
| until <line> | continue execution until line number | |
| list | l | show source (for line, function, offset, ...) |
| backtrace | bt | show the stack of functions. Add "full" to include local variables |
| thread apply all bt | t a a bt | show the stack of functions in all threads |
| print var | p | display a variable. Use p/x for hex |
| x/16xb <addr> | hexdump 16 bytes at address | |
| display | disp | display expression each time program stops |
| info locals | inf loc | display local variables |
| help ... | h | display online help |
| focus next | fs n | switch window (allows cursor keys in CMD window for e.g.) |
| [Ctrl-x a] | toggle the text windowing interface | |
| [Ctrl-L] | redraw the display (if program outputs for example) | |
| [Return] | repeat the last command |
Note one can also change defaults like enabling command history etc. in your
~/.gdbinit.
See also notes on triggering the debugger from code
See also GDB tricks from ksplice.
See also Exploring python using GDB from stripe.
See also TUI mode, integrated python, and Reverse debugging GDB tricks from Greg Law.