Note analysing web server logs can be better than using client side tools like google analytics for example, because some people disable (analytics) javascript, or directly download files not containing javascript like images and scripts etc. Also, requiring the user's system to make a separate request to the google analytics site slows things down for them. However client side tools may seldom be more accurate in the presence of caching.
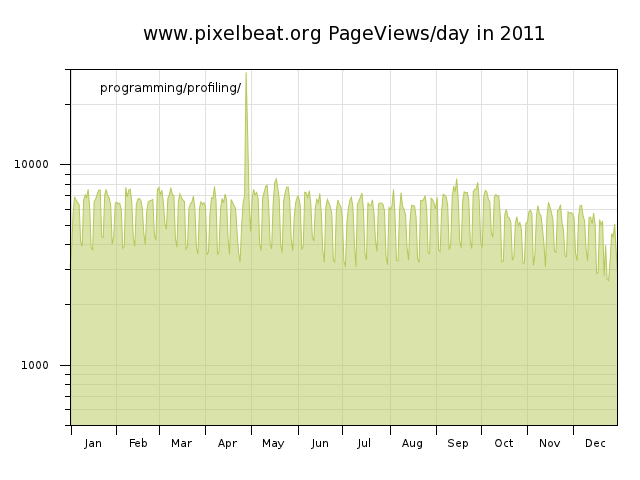
I'll just give some quick comments here on the pixelbeat.org traffic depicted above. One can see the traffic reduction every weekend and at xmas, but the general trend of the graph is upward which I attribute to the increasing amount of content here, but mostly due to the increasing popularity of linux, which is great to see. It's also worth noting that the web server has been working every day for at least 6 years. Thanks Paul!
In the graphs above one can see that a front page link from digg in Aug 2006 generated around 18000 extra views in a single day but this didn't really affect the long term trend. In 2007 the spikes of traffic were mainly from unwanted sources hotlinking images on my site (lifehacker being the exception), and a broken client downloading a single page in a loop. The hotlinking issue would have been much worse had I not taken steps to control this traffic using my .htaccess file, and its usefulness can be seen in the graph for 2008 with reddit being the main source of (very targetted) traffic spikes.splitting - rotating - archiving logs
The first thing we need to do to analyze the web server logs is to split the continuous access_log for processing. I split/archive my log every year but one can apply the same techniques per month etc.Now since there are usually multiple web server threads writing to the access_log file, its entries are mostly but not always monotonic with respect to dates which is problematic both for splitting the logs and future efficient processing of those logs. For example around day boundaries one can get a few entries for "tomorrow" before all the entries for the current day are committed to the log file.
To fix this we can sort the files using the timestamp available in each entry, and while this is quite an expensive operation it only needs to be done once. Each entry in the NCSA combined format access_log is in the following format.127.0.0.1 - - [01/Jan/2008:02:08:26 +0000] "GET /favicon.ico HTTP/1.1" ...One can see that all elements of the 4th field are fixed width, which means we can do an efficient ASCII sort for all elements except for the month abbreviation. Here we need to use the 'M' flag, which also requires us to explicitly specify the 'b' flag for both the start and stop positions. So in summary, to ensure all items in an access_log are monotonically increasing by date, do: sort -b -k4.9,4.12 -k4.5b,4.7Mb -k4.2,4.3 -k4.14,4 access_log. Note this sort command can be generally used to merge separate access_log files by passing them all as parameters (use the -m option to speed up merging already sorted files). To create the log archive we then combine this sort with a sed expression to ignore new entries we don't want in the archived log, and gzip for compression, to get:
export LANG=C
sort -b -k4.9,4.12 -k4.5b,4.7Mb -k4.2,4.3 -k4.14,4 access_log |
sed '/Jan\/2008/Q' | gzip > access_log.2007.gz
Now to remove all the items we've archived from the existing log is quite tricky. We can obviate the need to get apache to reopen log files (i.e. using apachectl graceful), by truncating the existing file and writing the required new entries to it. However because we don't stop apache serving requests at any stage, there is a window where logs may be lost:
# ---- start log loss window ----
#get last part of log
tac access_log | sed '/30\/Dec/Q' | tac |
#write required newer entries to tmp file
grep -F 'Jan/2008' > access_log.tmp
#use cp to truncate access_log and write new data to it.
#Note apache has same file opened in O_APPEND mode.
cp access_log.tmp access_log
# ---- end log loss window ----
rm access_log.tmp
processing - analyzing
So now we can get on to the interesting data analysis part. First here's a quick example to determine the total number of hits the web server had to deal with:$ for year in $(seq 2006 2014); do > printf "%'d\n" $(gzip -dc access_log.$year.gz | wc -l) > done 2,501,464 3,208,812 4,703,258 6,035,192 7,012,146 5,211,702 (drop mainly due to cloudflare caching) 3,691,495 3,115,901 3,465,659
A nice affect to note with using the compressed logs, is that the 9:1 compression ratio achieved means that the whole compressed log is cached in RAM. Therefore even though there is more CPU required for each processing run on the log, it proceeds much more quickly due to not having to access the hard disk.
For the plot above we need to generate a "page view" count per day, by filtering out requests from bots and to ancillary files, and merging all requests in a day to a single count. This is done by the following script.#!/bin/sh # output the PageViews per day from an access_log passed to stdin export LANG=C #for speed grep -Ev -f agents_to_ignore -f files_to_ignore | grep -Ev "( HEAD | 30[17] | 206 | 40[34] )" | #ignore certain HTTP status cut -d ' ' -f4 | #extract timestamp uniq -c -w11 | #merge and count hits per day sed 's/ *\([0-9]*\) \[\([^:]*\).*/\2 \1/' #extract date and count for each dayTo generate the plot from this list of dates and numbers, we process them with a gnuplot script. You might think that the gnuplot language is overkill for generating plots. But for any given plot there are many parameters one can set, so having a language to specify them is very useful indeed. gnuplot is one of those unix mini languages that I definitely recommend taking a few hours to learn. My coworkers say I'm gay for gnuplot, but it really is the dog's private bits for creating impressive plots quickly and reproducibly.
Now gnuplot flushes its stdin on startup (for questionable reasons IMHO), so the data points and script need to be merged to the stdin of the gnuplot process. This can be achieved using a subshell as shown below:
$ (cat pvpd.gpi; gzip -dc access_log.2007.gz | ./pvpd.sh) |
gnuplot > pageviews_2007.png
Note also the following plot() function, which is a general way to get gnuplot to plot a list of numbers on stdin.
plot() { { echo 'plot "-"' "$@"; cat; } | gnuplot -persist; }
seq 1000 | sed 's/.*/s(&)/' | bc -l | plot
seq 100 | shuf | plot with steps
Another thing to note about gnuplot is that I used the pngcairo "terminal"
which provides easy access to fonts, and supports both translucency and anti-aliasing.
This is only available in gnuplot 4.3 which is not released yet to contemporary linux distributions
like Fedora 8 and Ubuntu 7.10. But I found it simple to build the latest version by following
some simple instructions from the gnuplot site.
You can see the traditional non anti-aliased gnuplot output in this article
which applies 3D plotting techniques to web server logs.
This page was written on Jan 3 2008 and last updated on - Jan 5 2011